Что такое риск-премия за вложения в акции

Movchan's Group
Dec 31, 2023Рассказываем о том, что такое риск-премия за вложения в акции, как ее рассчитать и какие факторы влияют на нее. Также даем практические советы по управлению рисками на фондовом рынке.
Что такое риск-премия и от чего она зависит
Вложения в акции могут принести потенциально более высокую доходность по сравнению с инвестициями в менее рискованные активы, такие как облигации. За более высокие риски и потенциальные убытки инвесторы ожидают получить от рынка компенсацию. Потенциальная прибыль, которую инвесторы получают сверх условно безрисковой, называется риск-премией за вложения в акции или премией за рыночный риск (от англ. Equity Risk Premium, ERP).
Условно безрисковым считаются государственные ценные бумаги. Например, в США безрисковые активы — это государственные казначейские облигации (трежерис), а в России — облигации федерального займа (ОФЗ). Впрочем, для глобального инвестора ОФЗ не будут считаться безрисковыми, так как в них содержится страновая риск-премия.
Стоит понимать, что, хотя государственные облигации и являются бенчмарком, абсолютно безрисковых инструментов не существует. Помимо маловероятного, но возможного дефолта, на условно безрисковые активы также способна влиять, например, инфляция. Высокая инфляция в стране может обесценить реальную доходность облигаций. Кроме того, существует риск изменения процентных ставок: если они вырастут, рыночная цена облигаций снизится.
Управление рисками при инвестициях в акции
В инвестиционном анализе риск определяется как вероятность того, что фактическая доходность актива будет отличаться от ожидаемой. Он обычно делится на две составляющие: систематический и несистематический риски. Их понимание важно при оценке риска для различных типов акций и управления им.
Систематический риск
Также известный как рыночный риск, он влияет на весь рынок или его значительную часть. Его источниками могут быть рецессии, инфляция, колебания процентных ставок, политическая нестабильность, природные катастрофы и т.д. Инвестирование в разные страны может помочь смягчить влияние таких негативных событий, связанных с отдельной страной, на портфель. Тем не менее полностью избавиться от систематического риска невозможно, он считается неустранимым.
Систематический риск измеряется с помощью коэффициента бета (β), он же используется во многих методах оценки риск-премии. Коэффициент бета является мерой риска волатильности актива по сравнению с рынком. Он рассчитывается как ковариация доходности акции с доходностью рынка, деленная на дисперсию доходности рынка. Однако считать ее самостоятельно не обязательно — уникальный для конкретной акции бета-коэффициент можно легко найти на всех биржевых площадках.
Волатильность рынка традиционно принимается равной единице, поэтому интерпретация соотношения между бетой и ожидаемой чувствительностью к изменениям рынка для конкретного актива выглядит следующим образом:
- β = 0 — отсутствие рыночной чувствительности,
- β < 1 — низкая чувствительность к рынку,
- β = 1 — соответствует рынку (нейтральный риск),
- β > 1 — высокая чувствительность к рынку,
- β < 0 — отрицательная чувствительность к рынку.
Устранить этот риск невозможно, но им можно достаточно эффективно управлять с помощью стратегий хеджирования. Также стоит рассмотреть активы с низкой волатильностью (β) или те, которые менее подвержены макроэкономическим рискам, например из защитных секторов.
Несистематический риск
С несистематическим риском все проще: он связан с конкретной компанией или отраслью, иначе говоря, носит локальный характер. Источниками несистематического риска могут быть проблемы в управлении компанией, снижение спроса на товары определенной группы, а также появление нового конкурента, которое может снизить долю компании на рынке.
Несистематический риск можно уменьшить или устранить диверсификацией, поскольку он не затрагивает весь рынок целиком. Чем больше активов в портфеле, тем меньше рисков, связанных с отдельными компаниями или отраслями.
Как рассчитать риск-премию
Итак, риск-премия за вложения в акции — это разница между ожидаемой доходностью рынка акций и безрисковой ставкой доходности. Иными словами, премия за риск отражает прогноз того, насколько долгосрочные инвестиции в акции могут превзойти доходность безрисковых долговых инструментов. Логично, что риск-премия и ожидаемая доходность имеют прямую корреляцию: чем выше риск, тем больше ожидаемая премия, и наоборот. Это важно, потому что в некоторых случаях покупка даже потенциально высокодоходного актива может оказаться неоправданной из-за чрезмерных рисков.
Последовательность расчета риск-премии следующая:
- Спрогнозировать потенциальную доходность акций.
- Посмотреть ожидаемую доходность безрисковых облигаций.
- Вычесть разницу, чтобы получить величину риск-премии.
Основная сложность — в первом шаге.
Подходы к определению ожидаемой доходности
Прогнозирование изменения цен инструментов в будущем всегда остается оценочным и субъективным, а любое значение — теоретическим. Не все риски могут быть точно измерены и адекватно отражать рыночные условия через определенный промежуток времени. На оценку могут влиять такие факторы, как, например, риск волатильности, геополитические условия или макроэкономическая конъюнктура. Кроме того, восприятие риска инвесторами может различаться, что усложняет создание единой стандартной модели для расчетов.
Историческая доходность
Самый простой способ оценить ожидаемую доходность акций — использовать среднегодовую историческую доходность актива. В этом случае предполагается, что ретроспективные показатели служат ориентиром для будущей доходности. Формула для расчета выглядит следующим образом:

где:
Ra — ожидаемая доходность; R1, R2, …, Rn — историческая доходность за каждый год; n — количество лет.
Период для анализа может варьироваться в зависимости от предпочтений инвестора. Для получения наиболее репрезентативных результатов рекомендуется использовать более длительные сроки, например 5 или 10 лет. Также целесообразно оперировать скорректированными показателями, исключая разовые или нетипичные периоды с аномально высокими или низкими отклонениями от среднего. Это поможет получить результаты, максимально приближенные к реальности, и избежать искажений, вызванных экстремальными рыночными событиями, такими как пандемия COVID-19 или финансовый кризис 2008 года.
Этот подход легок в использовании, но имеет ряд ограничений. Основное из них заключается в том, что прошлая доходность не гарантирует сопоставимых результатов в будущем. Если акции снижались, то совсем не обязательно, что и в будущем их доходность будет отставать. Кроме того, метод не учитывает текущую рыночную конъюнктуру и возможные события, такие как рецессии или, например, рыночные пузыри.
Поэтому для более точной оценки ожидаемой доходности акций используются и другие методы, например модель оценки капитальных активов (CAPM) или модель дисконтированных дивидендов (модель роста Гордона).
Модель оценки капитальных активов
Модель оценки капитальных активов (CAPM) — это фундаментальная и одна из самых популярных моделей, которая помогает инвесторам оценивать ожидаемую доходность активов с учетом их систематического риска (β) относительно рынка в целом. CAPM является важным инструментом в современной финансовой теории, особенно в контексте портфельного инвестирования и оценки стоимости капитала.
Записывается она так:

где:
Ra — ожидаемая доходность; Rf — доходность безрискового актива;

Обычно для оценки ожидаемой доходности рынков используются бенчмарки. Для расчета риск-премии на рынке США лучше всего подходят индексы S&P 500 и NASDAQ. Для развивающихся рынков актуальным будет MSCI Emerging Markets Index. Для оценки риск-премии диверсифицированного по регионам портфеля подойдет индекс MSCI World.
Подходы к оценке могут различаться: некоторые инвесторы предпочитают использовать ретроспективные данные по доходности, в то время как другие опираются на консенсусные прогнозные оценки аналитических агентств и инвестиционных банков.
Включение в CAPM премии за страновой риск
Несмотря на распространенность, у модели CAPM есть ряд недостатков. Например, она основывается на допущениях и не учитывает экстремальные искажения, за что и подвергается критике со стороны специалистов в области финансов. Одна из популярных модификаций CAPM предполагает корректировку за страновой риск (CRP), для которой существует три подхода:
Каждая компания за пределами США в равной степени подвержена страновому риску. В этом случае классическая модель трансформируется следующим образом:

Подверженность компании страновому риску аналогична другим ее рыночным рискам. В этом случае расширить традиционную CAPM нужно так:

Страновой риск — отдельный фактор. В этом подходе CRP умножается на переменную, обычно обозначаемую как лямбда (λ). Однако углубляться в эту модификацию мы не будем.
Премия за страновой риск (CRP) основывается на том, что геополитические и экономические риски оказывают неравномерное влияние на различные страны. К ним относят, например, вероятность войны. Основные геополитические риски в режиме реального времени отслеживает BlackRock. Также учитываются экономические риски, например рецессии, дефолты, способность обслуживать госдолг, колебания валют и т.д. Премия за риск на отдельных развивающихся рынках, как правило, выше, чем для развитых стран.
Рассчитывать страновой риск не нужно, актуальные значения публикует один из наиболее известных специалистов по корпоративной оценке Асват Дамодаран. Его данные считаются одними из самых точных и широко используются в среде профессиональных финансистов.
Трехфакторная модель Фамы — Френча
Эдвард Фама и Кеннет Френч — выдающиеся экономисты, известные своими работами в области финансов. Их исследования значительно повлияли на понимание того, как различные факторы воздействуют на доходность активов и как инвесторы могут использовать эти знания для оптимизации своих портфелей. Они также разработали Трехфакторную модель Фамы — Френча, которая расширяет традиционную CAPM, добавляя к рыночному риску два дополнительных фактора — размера и стоимости.
Эти дополнительные факторы учитывают тенденцию, согласно которой более мелкие компании превосходят более крупные, а также эти факторы позволяют оценить риск для различных типов акций, например роста и стоимости. Вот как их можно определить:
- Акции стоимости — это бумаги компаний, торгующихся ниже их предполагаемой справедливой стоимости. Обычно такие компании достигли стабильного уровня развития и имеют устойчивый бизнес.
- Акции роста — это бумаги компаний с высокими темпами роста выручки и прибыли, превышающими средние рыночные показатели.
Исследования Фамы и Френча показывают, что доходность акций компаний малой капитализации в США в среднем обгоняли акции большой капитализации на 285 базисных пунктов в год с 1926 по 2012 год. Правда, в последние годы акции малой капитализации с трудом догоняли акции большой капитализации. В 2024 году разрыв увеличился из-за быстрого роста крупных технологических компаний, в частности «Великолепной семерки»: Apple, Microsoft, Alphabet, Amazon, Nvidia, Meta Platforms и Tesla. Это ралли спровоцировано ажиотажем вокруг искусственного интеллекта.
Формула Трехфакторной модели Фамы — Френча выглядит следующим образом:

где:

SMB (Small Minus Big) — фактор размера. Исторически компании с малой капитализацией показывают более высокую рыночную доходность по сравнению с крупными, а SMB измеряет эту разницу;
HML (High Minus Low) — фактор стоимости. Он измеряет разницу в доходности между акциями с высокой и низкой book-to-market-стоимостью, т.е. соотношением между балансовой и рыночной стоимостью компании. Акции с высокой book-to-market-стоимостью (представляющие компании, которые считаются недооцененными) обычно демонстрируют более высокую доходность по сравнению с акциями с низким показателем.
Информацию о переменных модели — доходностях и значениях факторов — можно найти здесь.
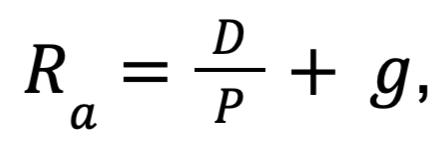
Модели роста Гордона
Модель роста Гордона, также известная как модель дисконтирования дивидендов (Dividend Discount Model, DDM), была предложена в 1960-х годах американским экономистом Майроном Дж. Гордоном.
Формула достаточно проста:

где:
D — ожидаемый дивиденд на акцию в следующем периоде, обычно — год; P — текущая цена за акцию; g — темп роста дивидендов, может быть оценен как на основе ретроспективных данных, так и прогнозных значений.
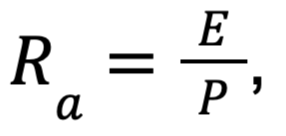
Другой вариант — использовать рост прибыли, а не дивидендов; тогда формула будет выглядеть зеркально мультипликатору P/E:

где:
E — прибыль на акцию за последние двенадцать месяцев (EPS).
Теория стала фундаментом для многих методов оценки стоимости бизнеса и акций. Она основана на предположении, что текущая цена акции равна приведенной стоимости всех будущих дивидендов, которые она будет приносить. Эта модель особенно полезна при расчете риск-премии для дивидендных аристократов — компаний, которые на протяжении не менее 25 лет ежегодно увеличивают размер дивидендов. В этот список входят, например, Coca-Cola, Exxon Mobil и AbbVie.
Основное ограничение обеих моделей — высокая чувствительность к изменениям параметров. Даже их небольшое отклонение может существенно повлиять на оценку. Кроме того, они допускают, что текущая цена на акции никогда не бывает справедливой, а это считается существенным недостатком, учитывая склонность фондового рынка к волатильности.
Что в итоге
Премия за риск отражает дополнительную доходность, которую инвесторы ожидают получить за принятие на себя неопределенности и потенциальных убытков, связанных с конкретными инвестициями.
Расчет риск-премии позволяет инвесторам не только оценить привлекательность акций, но и принимать более взвешенные решения при формировании портфелей.

